
The Calls by Source Channel report summarizes your incoming phone calls by the source channel the caller arrived from.
Tip The Calls by Source Channel Report is designed to help digital marketers see what source channels are converting the most phone calls on their site.
Calls by Source Channel Report
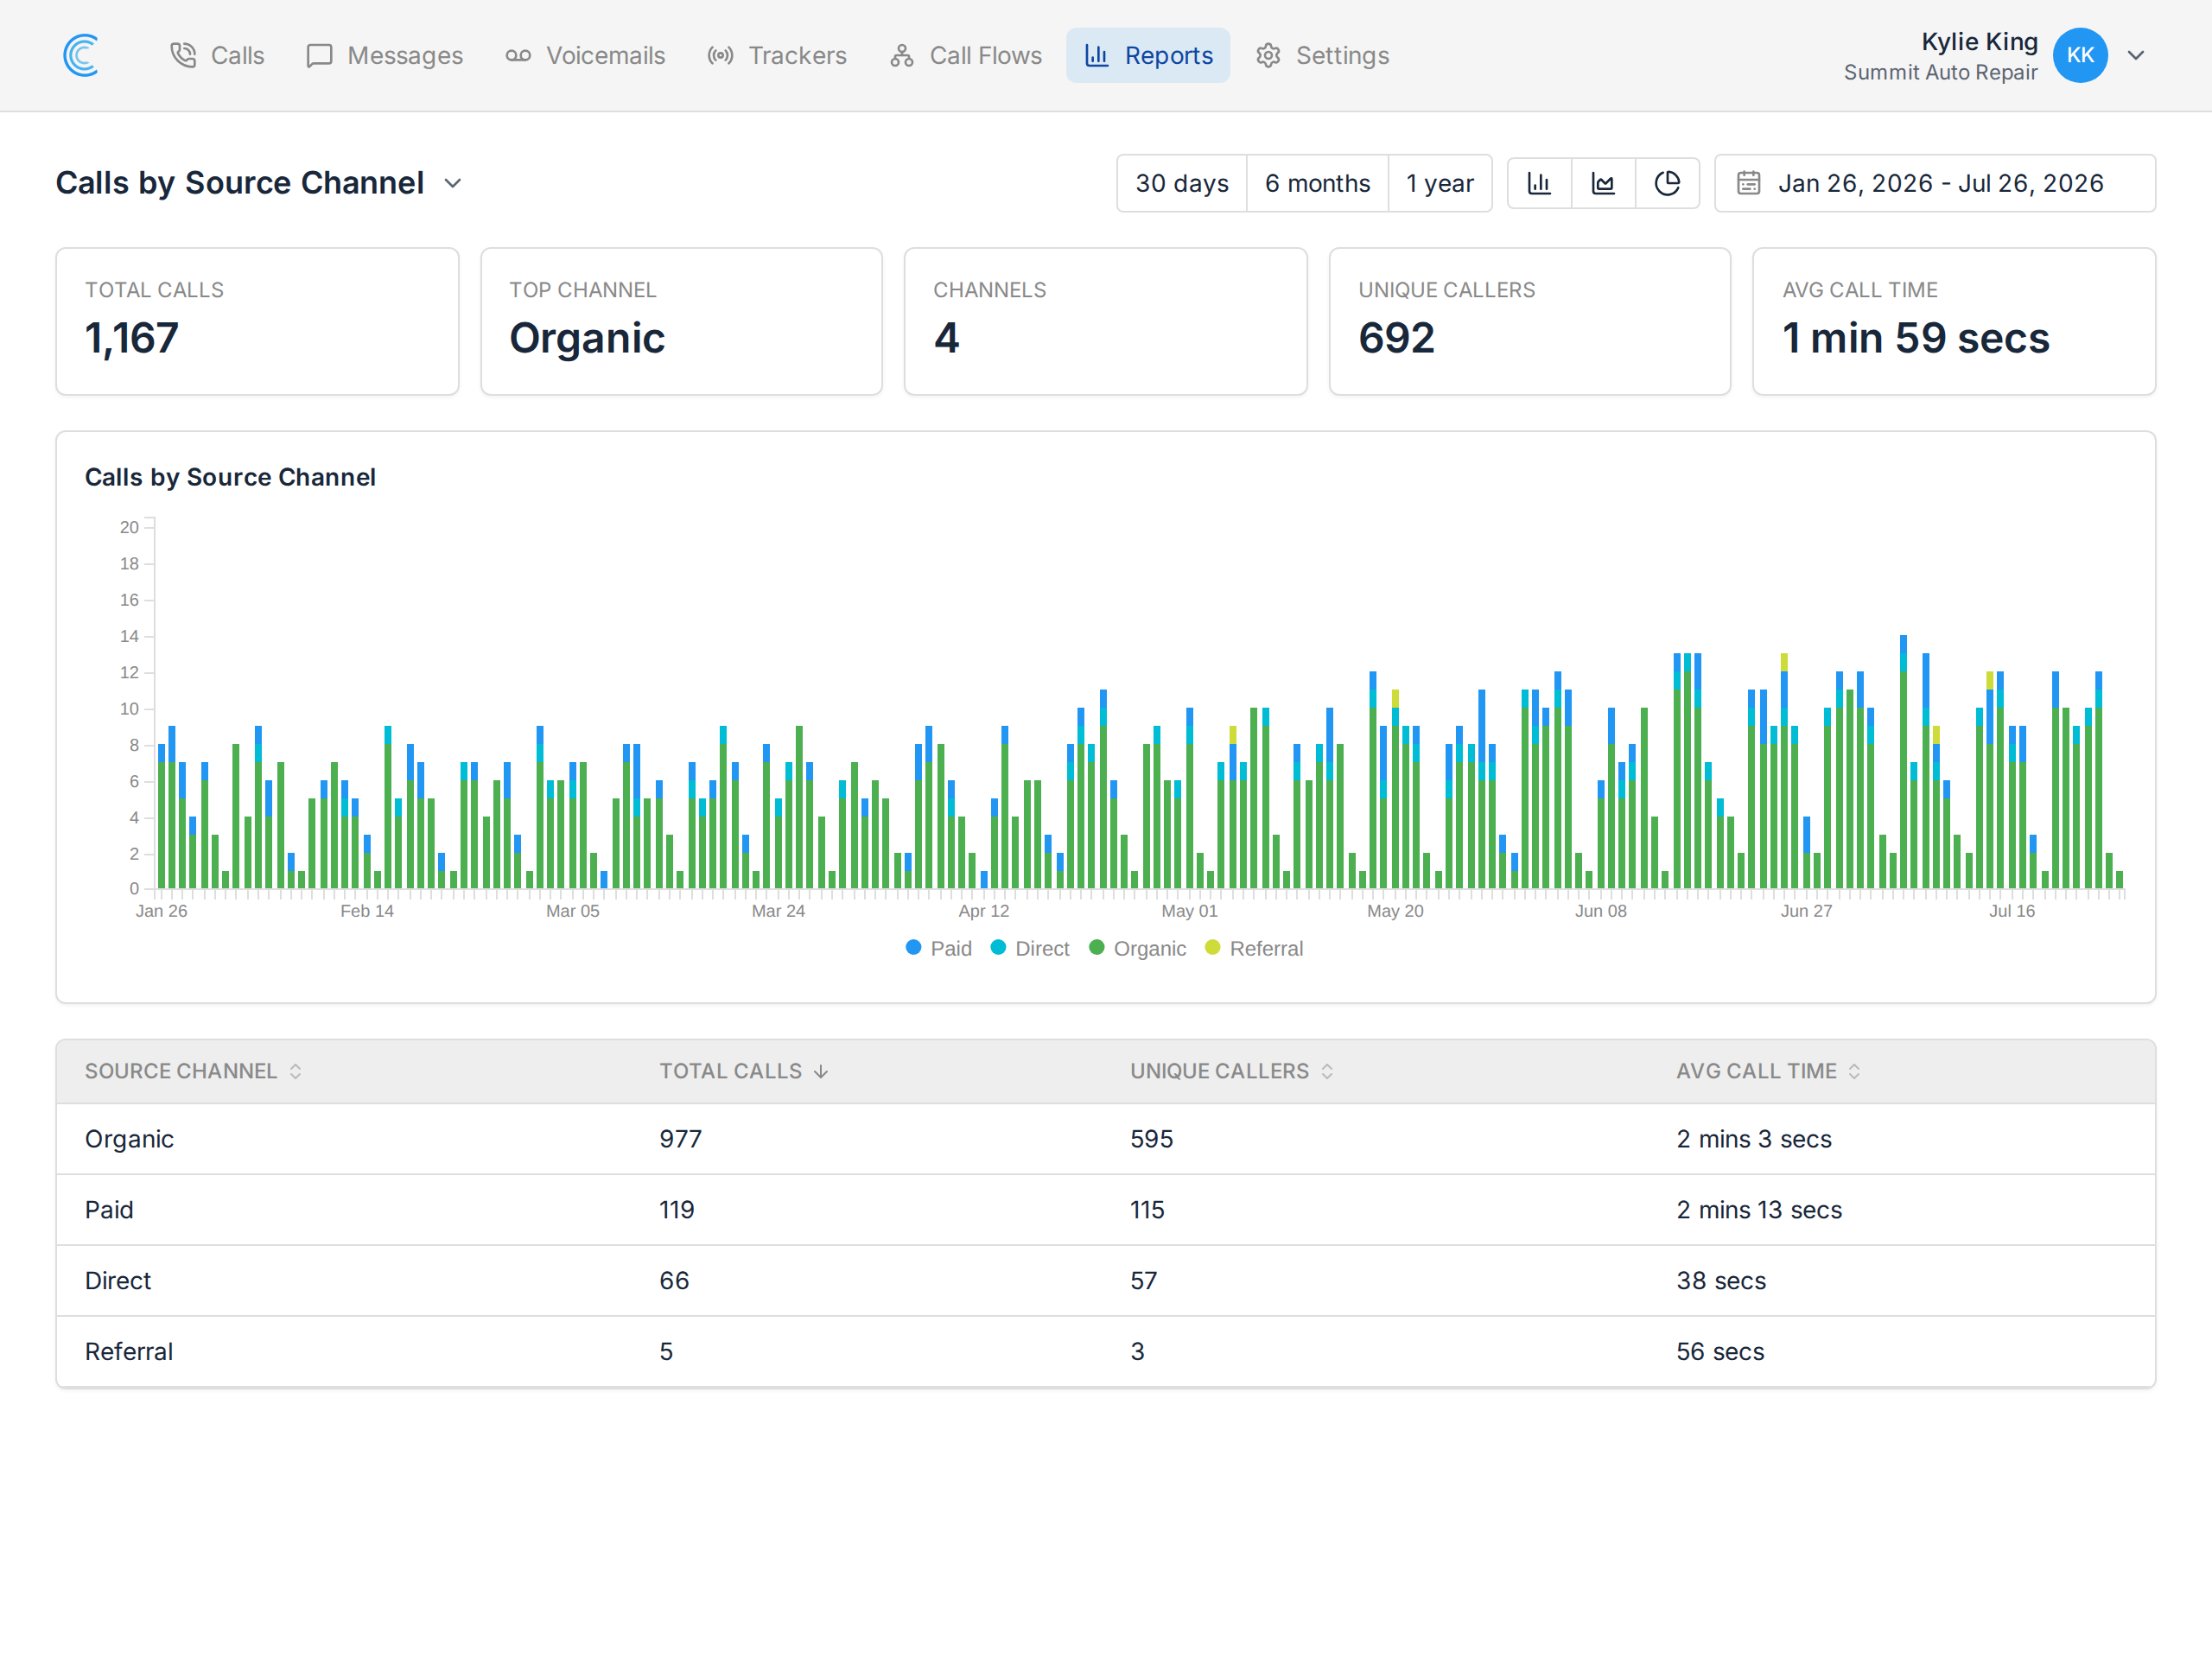
To access this report, click Reports in the navigation bar. Once in the Reports section, click the report title in the upper left of the screen to reveal a dropdown with all of the reports available, select Calls by Source Channel.
Changing the Chart Type
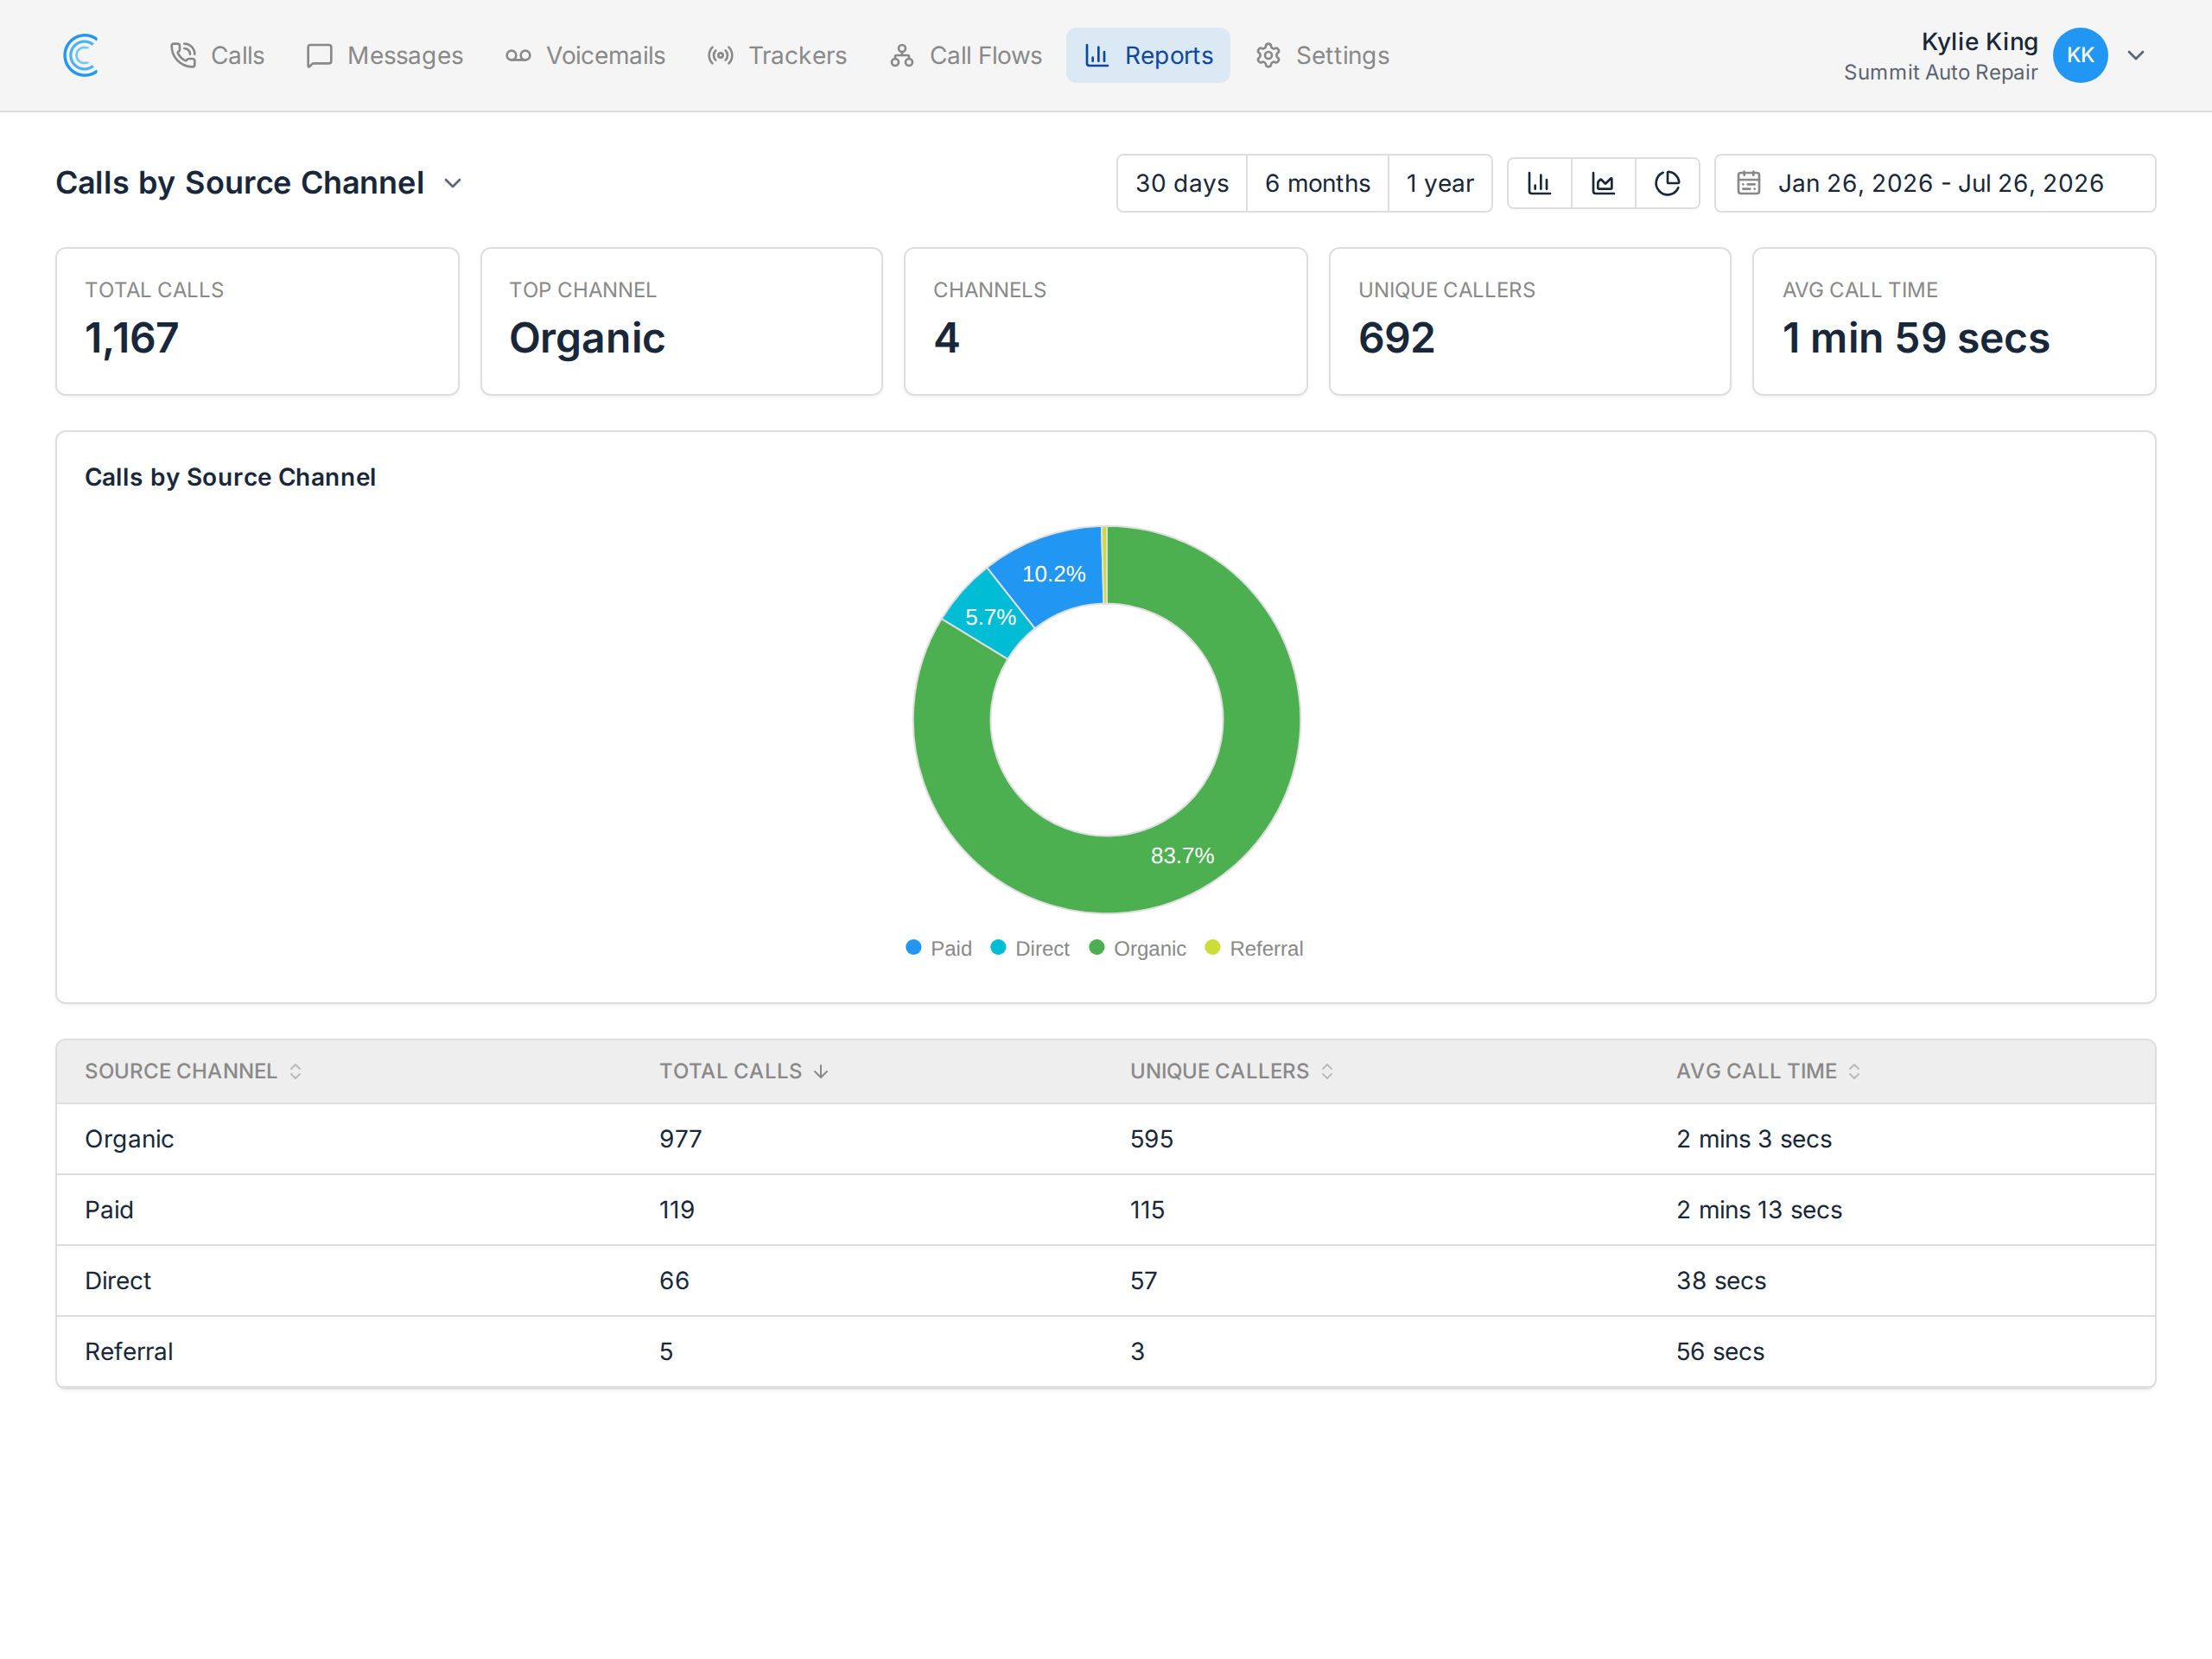
Sometimes it's useful to visualize data with a different chart type to for it to provide more value. There are three different chart types available:
- Stacked Bar Chart - Great for seeing trends over time.
- Area Line Chart - similar to a stacked bar chart, shows trends over time very well.
- Donut - great for summarizing data and seeing portional variances.
Changing the Chart Date Range
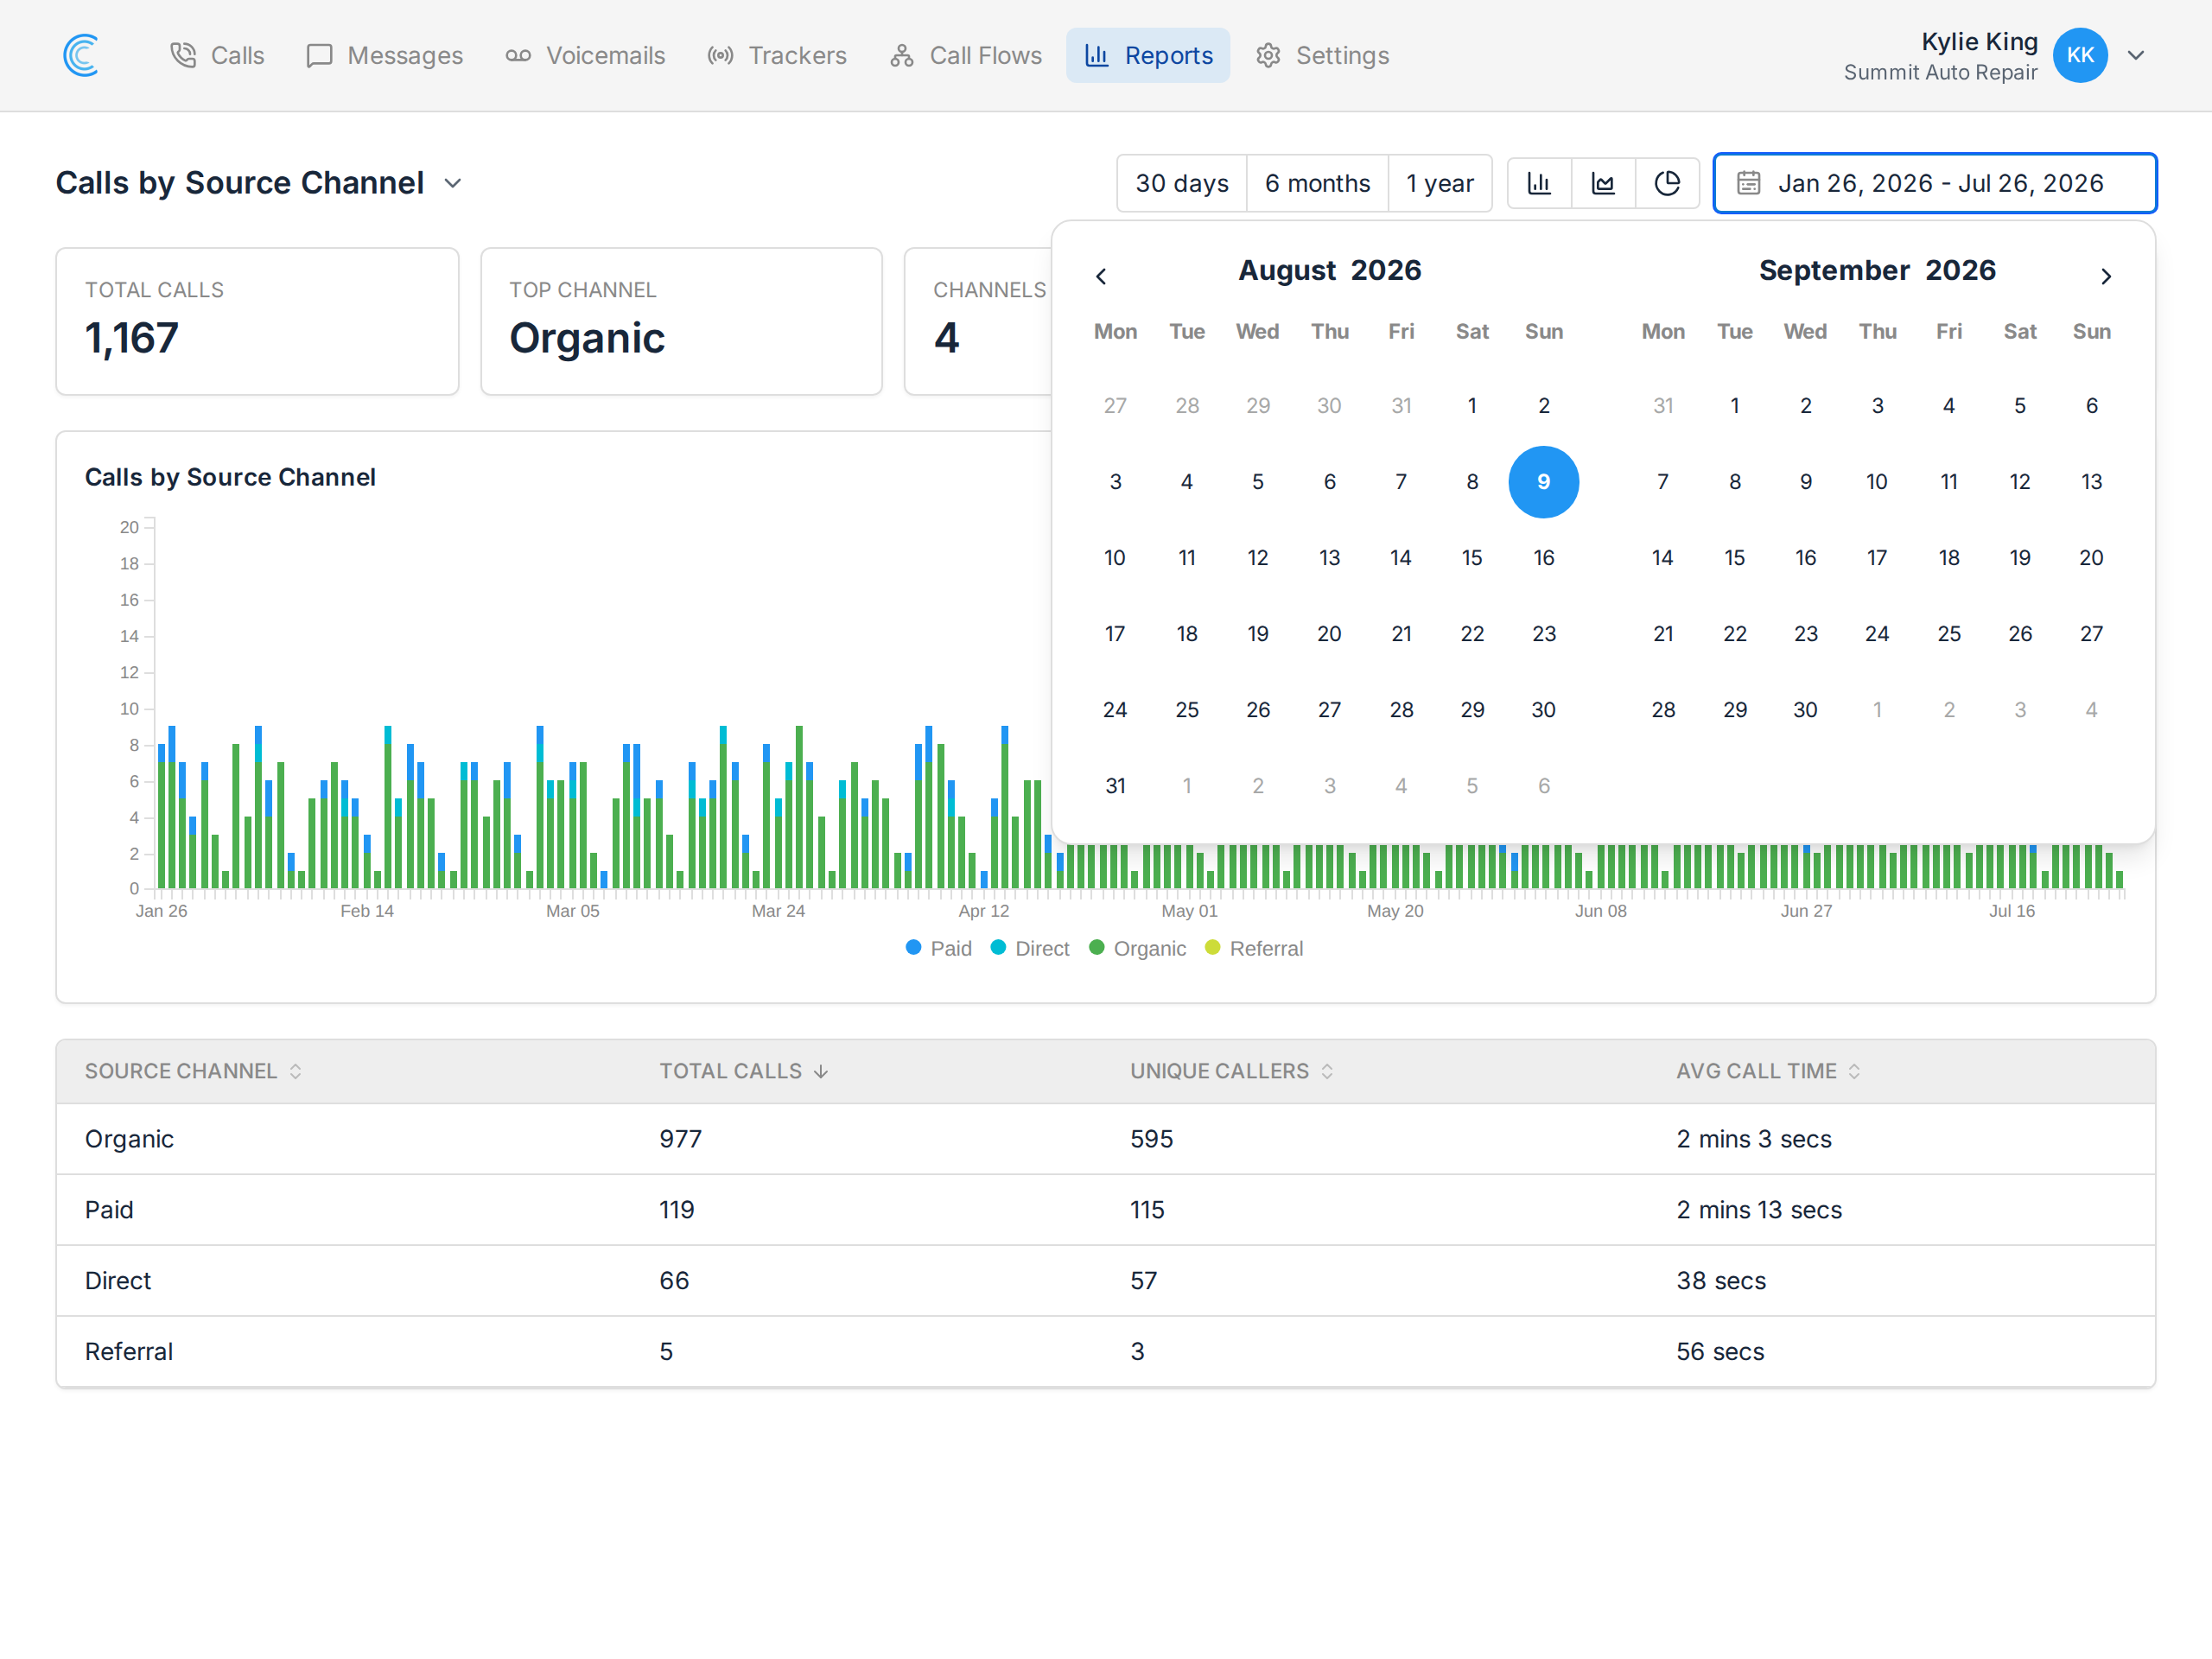
In many cases it might be useful to change the date range for the data you want to see. For example, you might want to see calls over the last 6 months or the last year. Use the date range tool just above the chart as needed.